The index reveals the vast differences in the cost of living across the country. It was based on six data points: home prices, rent, groceries, healthcare, utilities, and transportation, and we published the index in January 2026 using data collected in late 2025. Prices have moved since then, so treat these figures as a snapshot rather than today's prices.
Looking for the interactive explorer? If you’re looking for the interactive version of the index, we have now retired it. This article summarises our findings. |
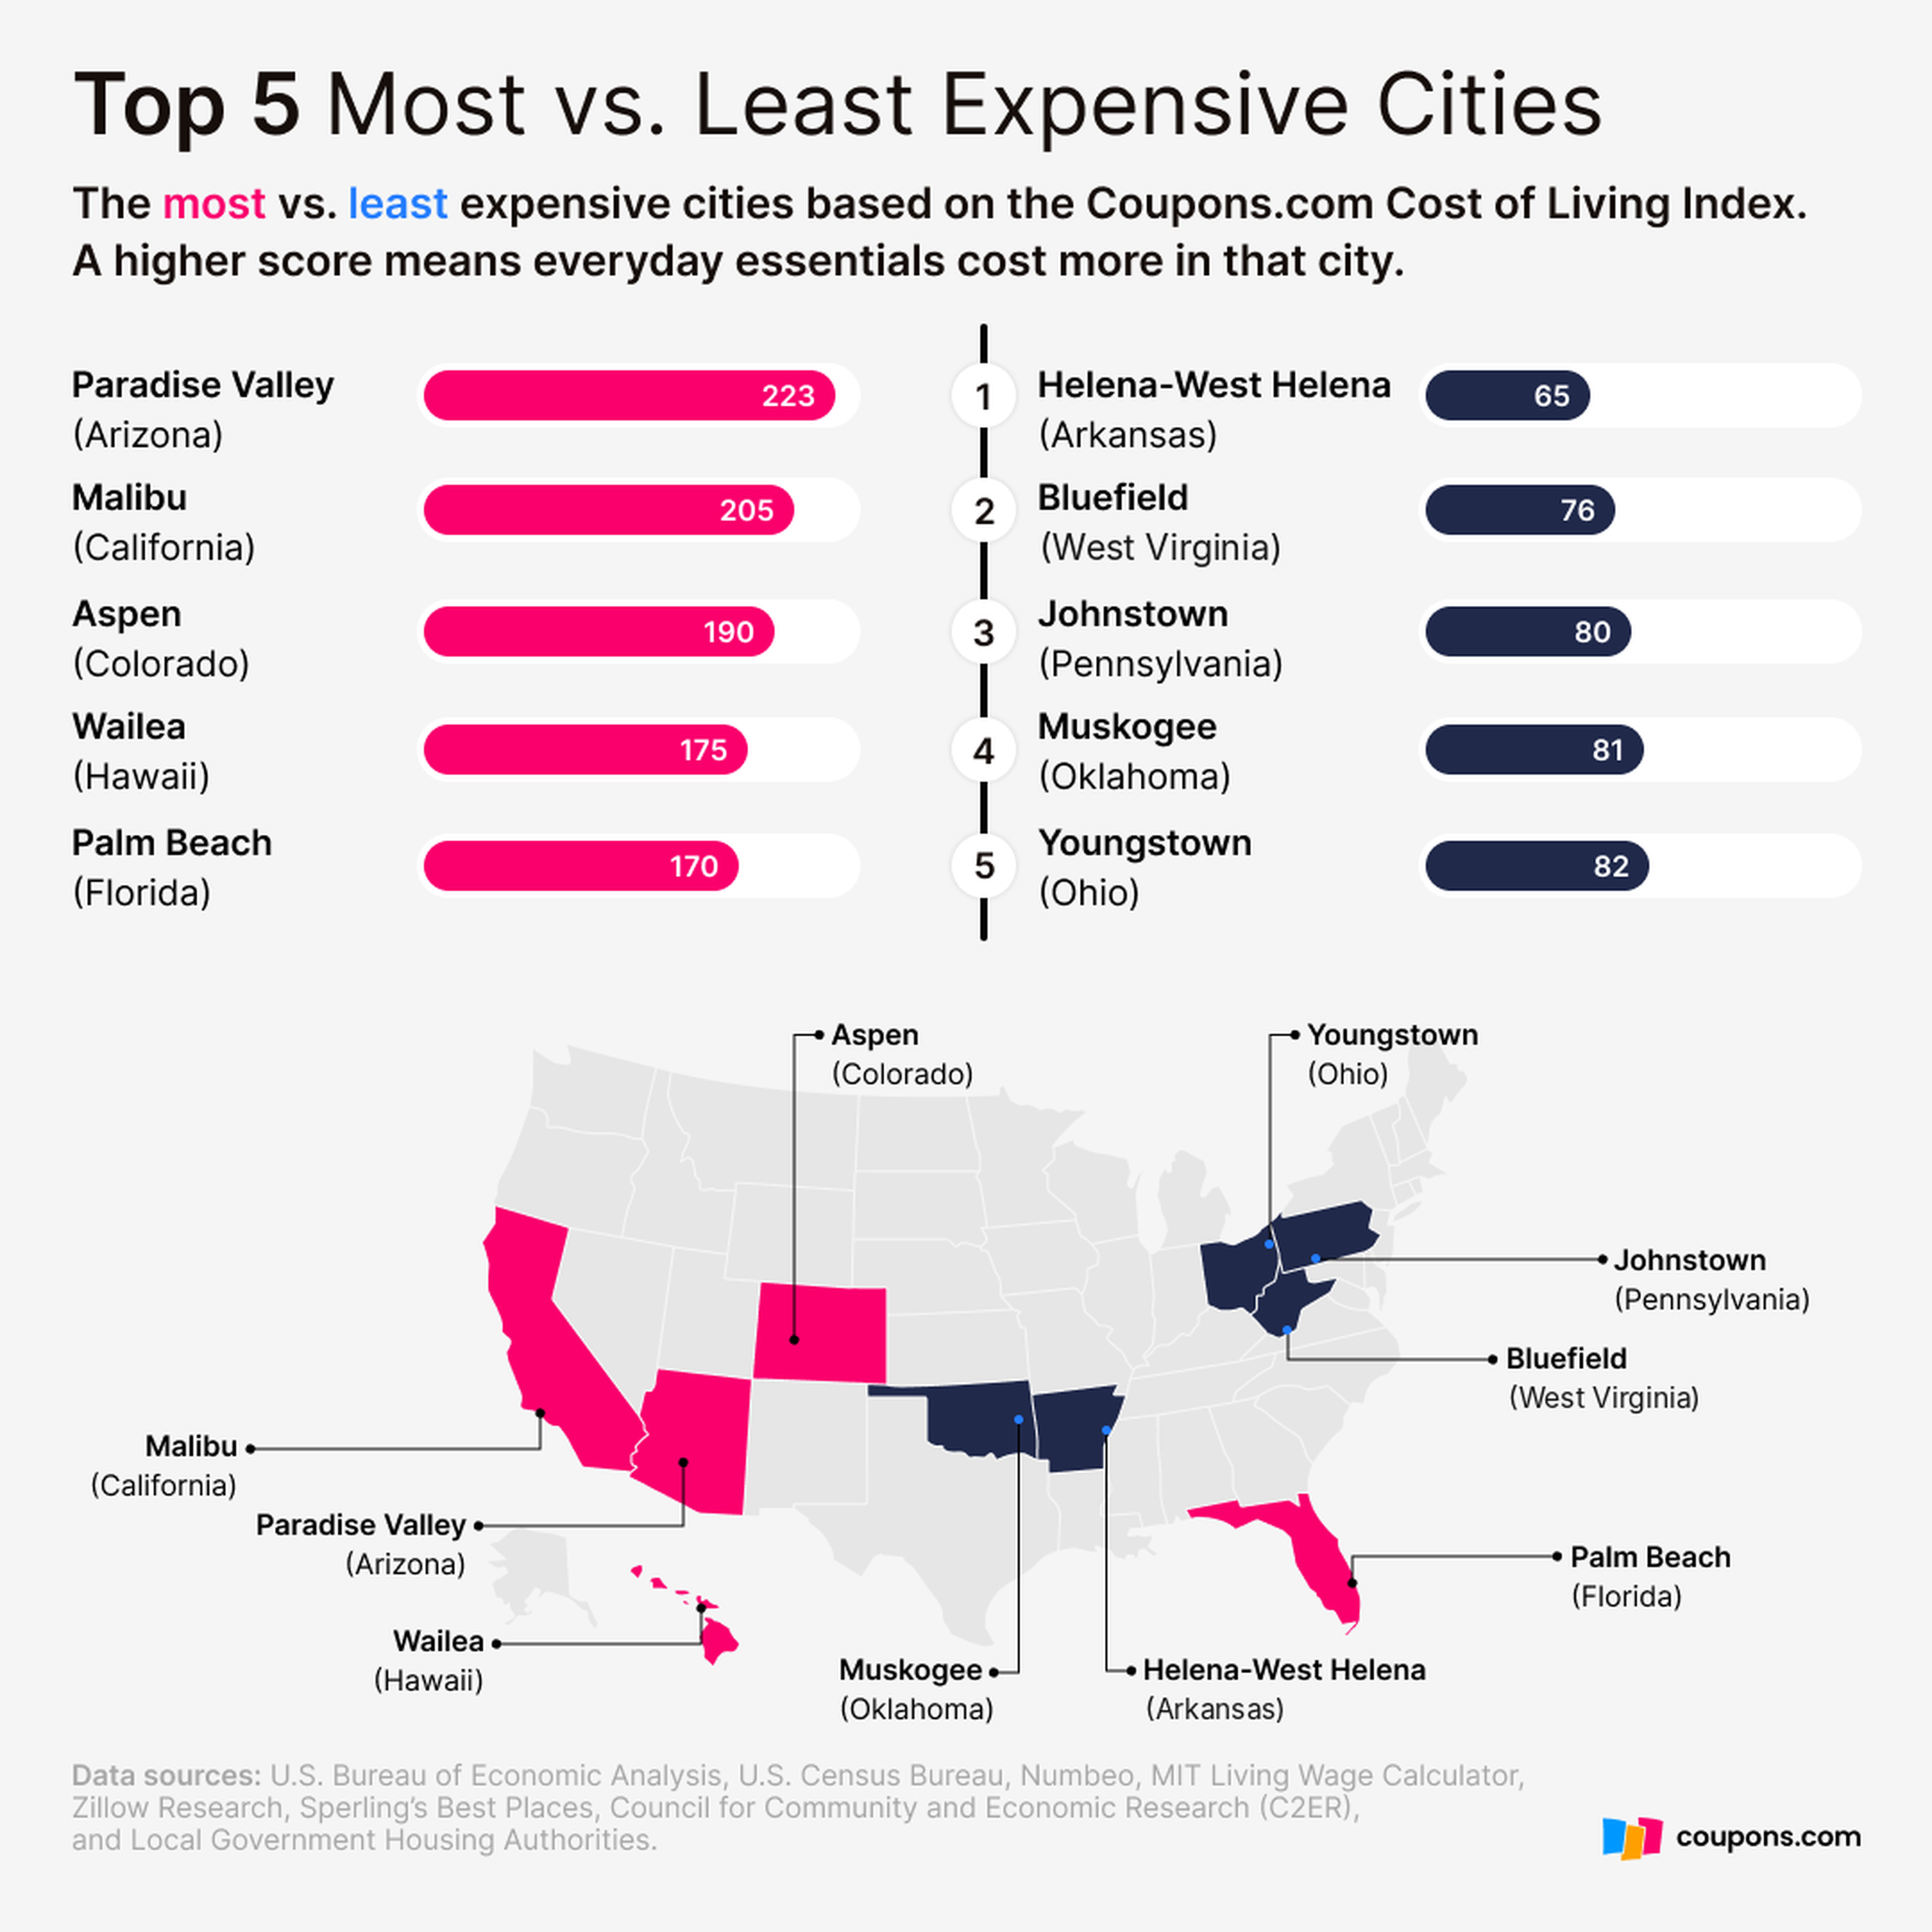
Key findingsAt the top end, Paradise Valley, Arizona, emerged as the most expensive city, with an index score of 223.
Helena-West Helena, Arkansas, was the most affordable with a score of 65 - well below the national average.
At the state level, California and Colorado dominate the top of the list. 9 of the 10 most expensive cities are in one of these states, with Malibu (205) and Aspen (190) amongst the most expensive.
Arkansas leads on affordability. The six most affordable cities on the list are in Arkansas, with many cities in West Virginia also amongst the most affordable in the country.
It comes as no surprise that Hawaii is a consistently expensive state. The two most affordable cities in the state, Kurtistown and Pahala, both score 127, which sits comfortably above the national average. Alaska is similar, as its cheapest state scores 117.
There is almost a tenfold difference between rent in the cheapest and most expensive places, from $550 in Hope, Arkansas, to $5,200 in Malibu, California.
The 10 most expensive cities in the USParadise Valley, Arizona, won by a sizeable margin, 18 points higher than Malibu, California (223 compared to 205, respectively).
Rank | City | State | Index score | Median home price | Avg. monthly rent | Groceries | Healthcare | Utilities | Transport |
1 | Paradise Valley | Arizona | 223 | $3,270,191 | $3,305 | 110 | 120 | 115 | 130 |
2 | Malibu | California | 205 | $3,500,000 | $5,200 | 131 | 136 | 141 | 162 |
3 | Palo Alto | California | 200 | $3,400,000 | $5,000 | 130 | 135 | 140 | 160 |
4 | Beverly Hills | California | 195 | $3,100,000 | $4,500 | 128 | 132 | 138 | 158 |
5= | Aspen | Colorado | 190 | $2,700,000 | $4,800 | 125 | 130 | 140 | 150 |
5= | Newport Beach | California | 190 | $2,800,000 | $4,700 | 129 | 134 | 137 | 157 |
7 | Snowmass Village | Colorado | 188 | $2,600,000 | $4,700 | 125 | 129 | 139 | 150 |
8 | Telluride | Colorado | 187 | $2,400,000 | $4,600 | 124 | 129 | 139 | 149 |
9= | Santa Monica | California | 185 | $1,800,000 | $4,200 | 126 | 131 | 136 | 155 |
9= | Vail | Colorado | 185 | $2,300,000 | $4,500 | 124 | 128 | 138 | 148 |
The 10 most affordable cities in the USArkansas is the place to be for affordability, scooping seven of the 10 spots, with West Virginia cities taking the other three.
Rank | City | State | Index score | Median home price | Avg. monthly rent | Groceries | Healthcare | Utilities | Transport |
1 | Helena–West Helena | Arkansas | 65 | $41,400 | $590 | 70 | 68 | 70 | 72 |
2 | Forrest City | Arkansas | 66 | $65,000 | $680 | 71 | 69 | 71 | 73 |
3= | Blytheville | Arkansas | 67 | $76,306 | $1,350 | 72 | 70 | 72 | 74 |
3= | Hope | Arkansas | 67 | $80,537 | $550 | 72 | 70 | 72 | 74 |
5 | El Dorado | Arkansas | 68 | $127,824 | $950 | 73 | 71 | 73 | 75 |
6 | Camden | Arkansas | 69 | $101,184 | $1,500 | 73 | 71 | 73 | 75 |
7= | Bluefield | West Virginia | 76 | $85,000 | $750 | 80 | 78 | 75 | 77 |
7= | West Memphis | Arkansas | 76 | $111,612 | $745 | 76 | 74 | 75 | 77 |
9 | Beckley | West Virginia | 77 | $90,000 | $775 | 81 | 79 | 76 | 78 |
10 | Logan | West Virginia | 78 | $95,000 | $800 | 82 | 80 | 77 | 79 |
The data behind the indexWondering how we created these lists? Here’s more information on the different types of data that made up the index.
Median home price: This is the midpoint of all home sale prices in that city. Half of the homes are sold for more, and half are sold for less. It reflects the typical cost of buying a home and is based on market data.
Rent per month: This is the average monthly cost of renting a property. The figure is usually based on average rent in the city, including one-bedroom, two-bedroom, and three-bedroom apartments in the city centre or surrounding area.
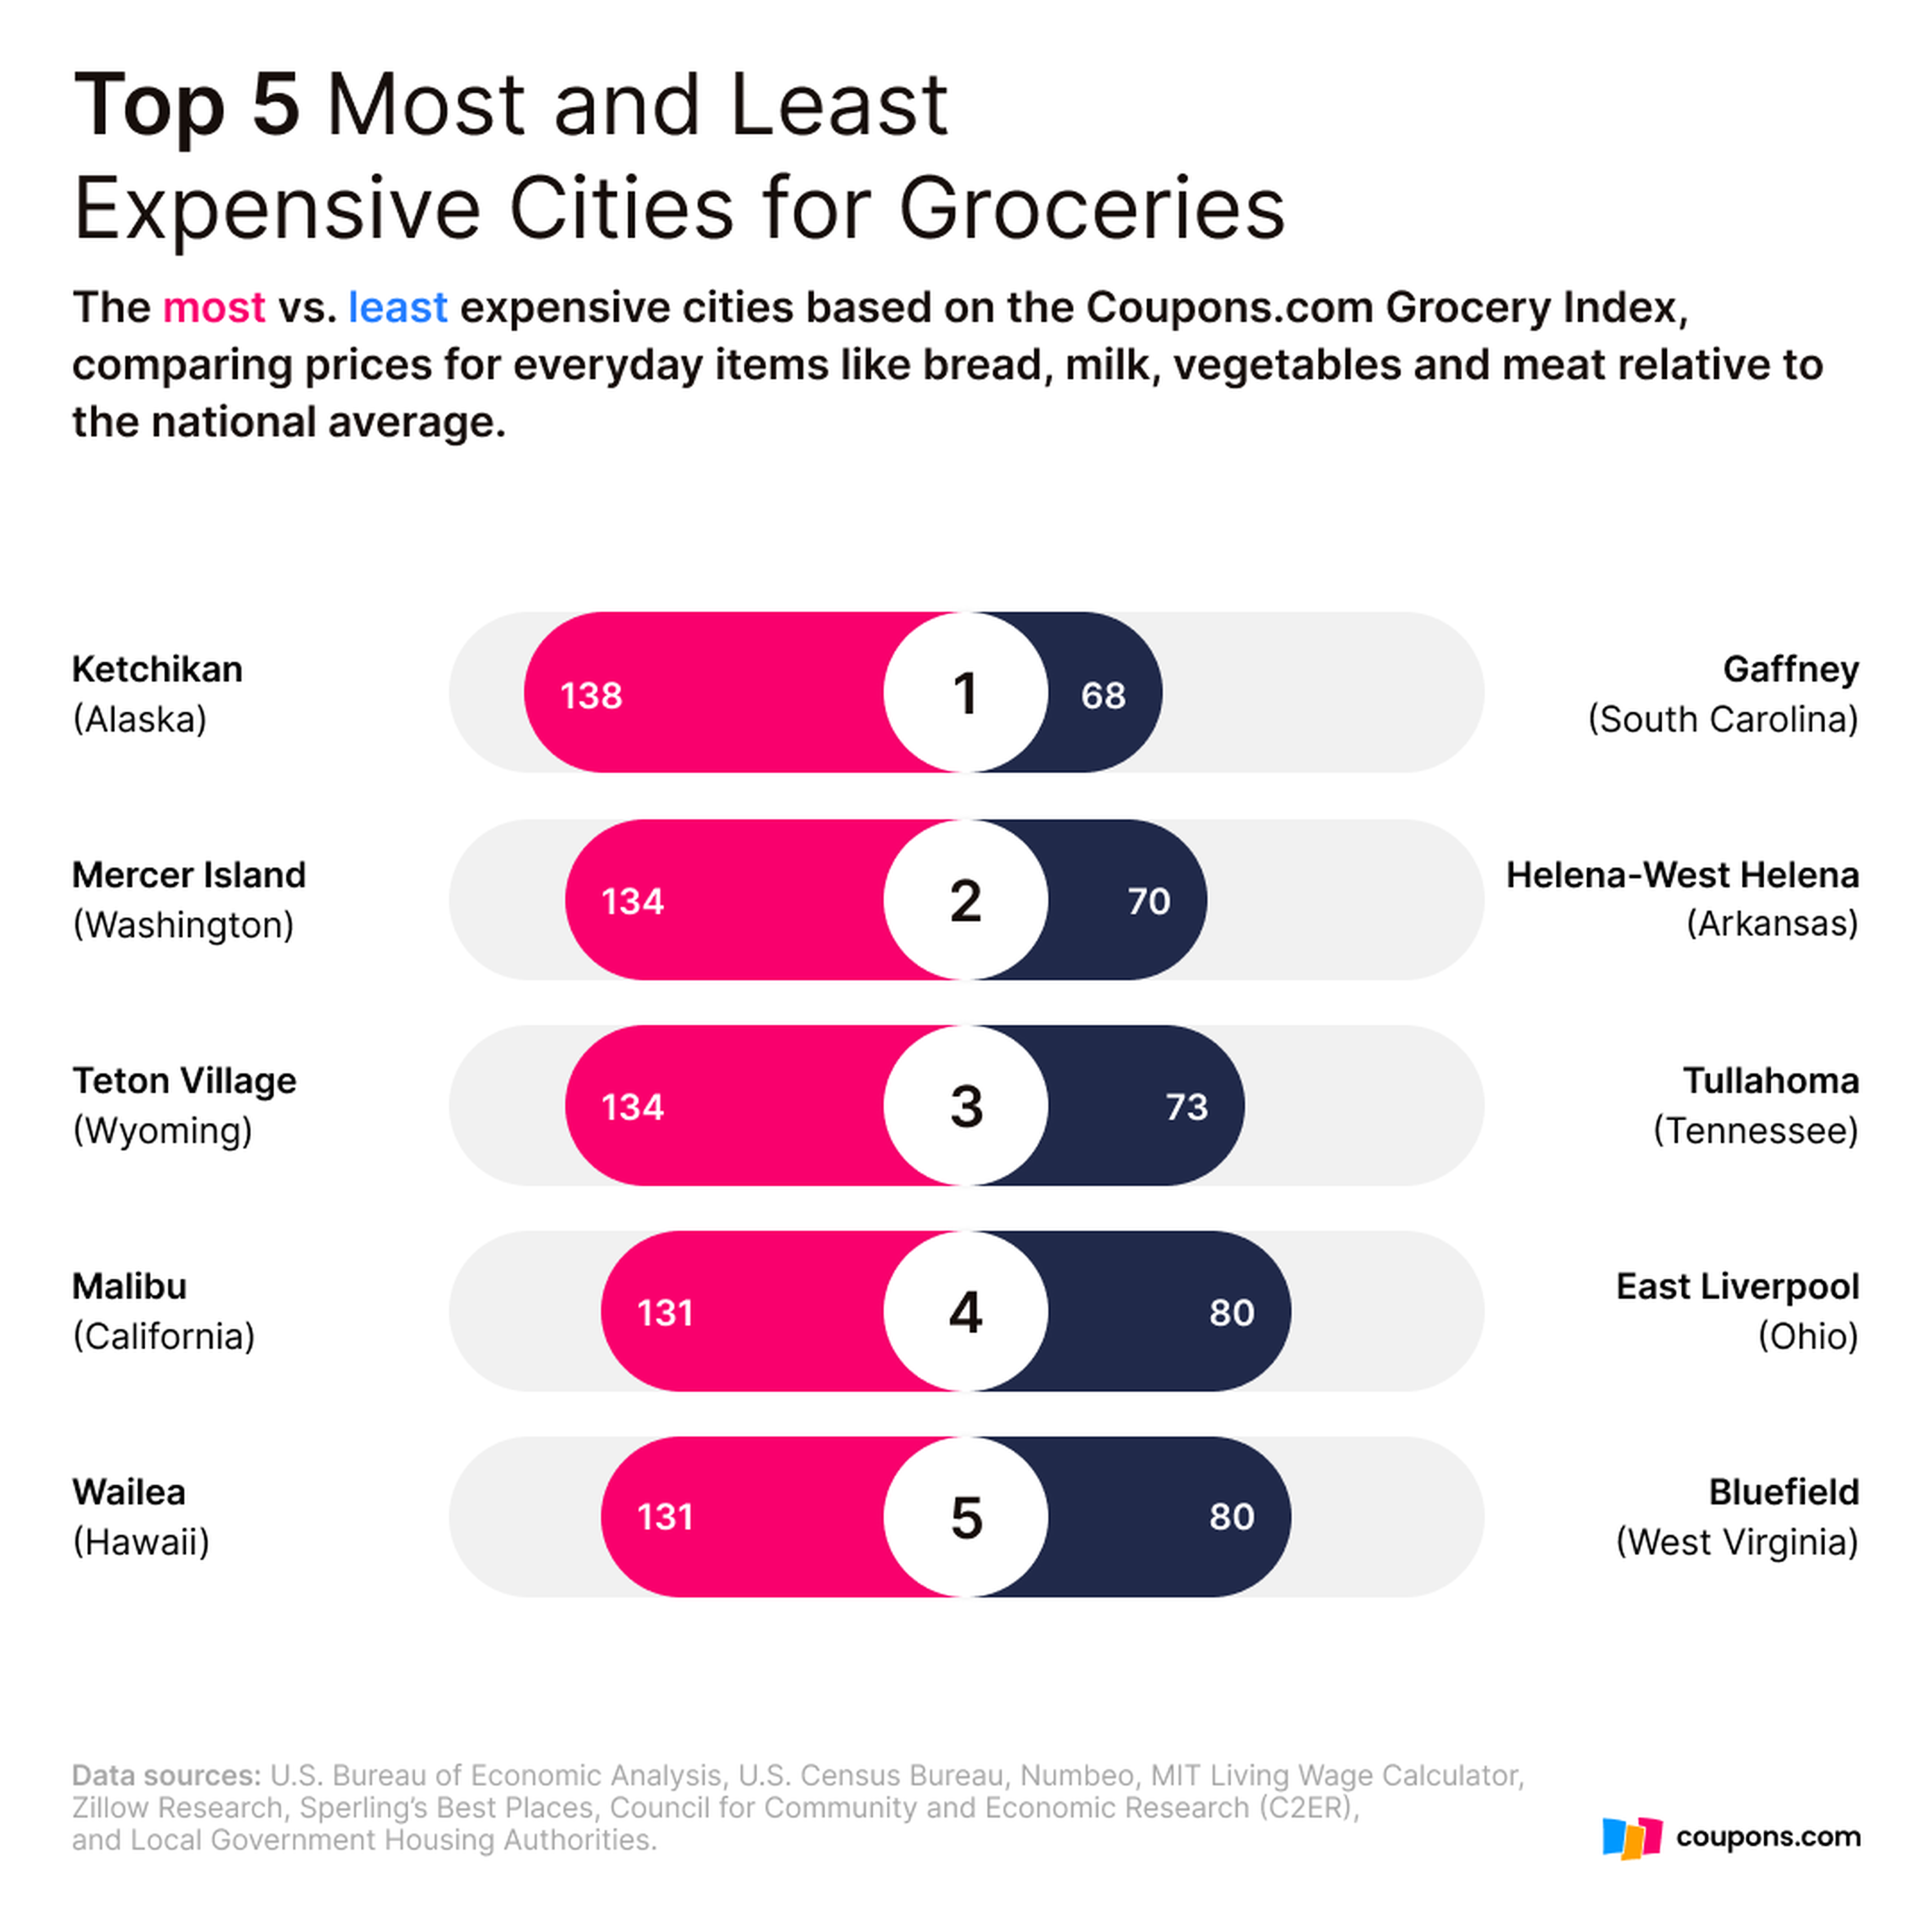
Grocery index: This shows how much more or less you would pay for everyday food items such as bread, milk, vegetables, and meat compared to the national average.
Utilities index: This reflects the cost of basic household bills such as electricity, gas, water and rubbish collection. Higher scores mean more expensive utility bills.
Transport index: This covers the cost of getting around the city, including petrol, public transport, car insurance and repairs.
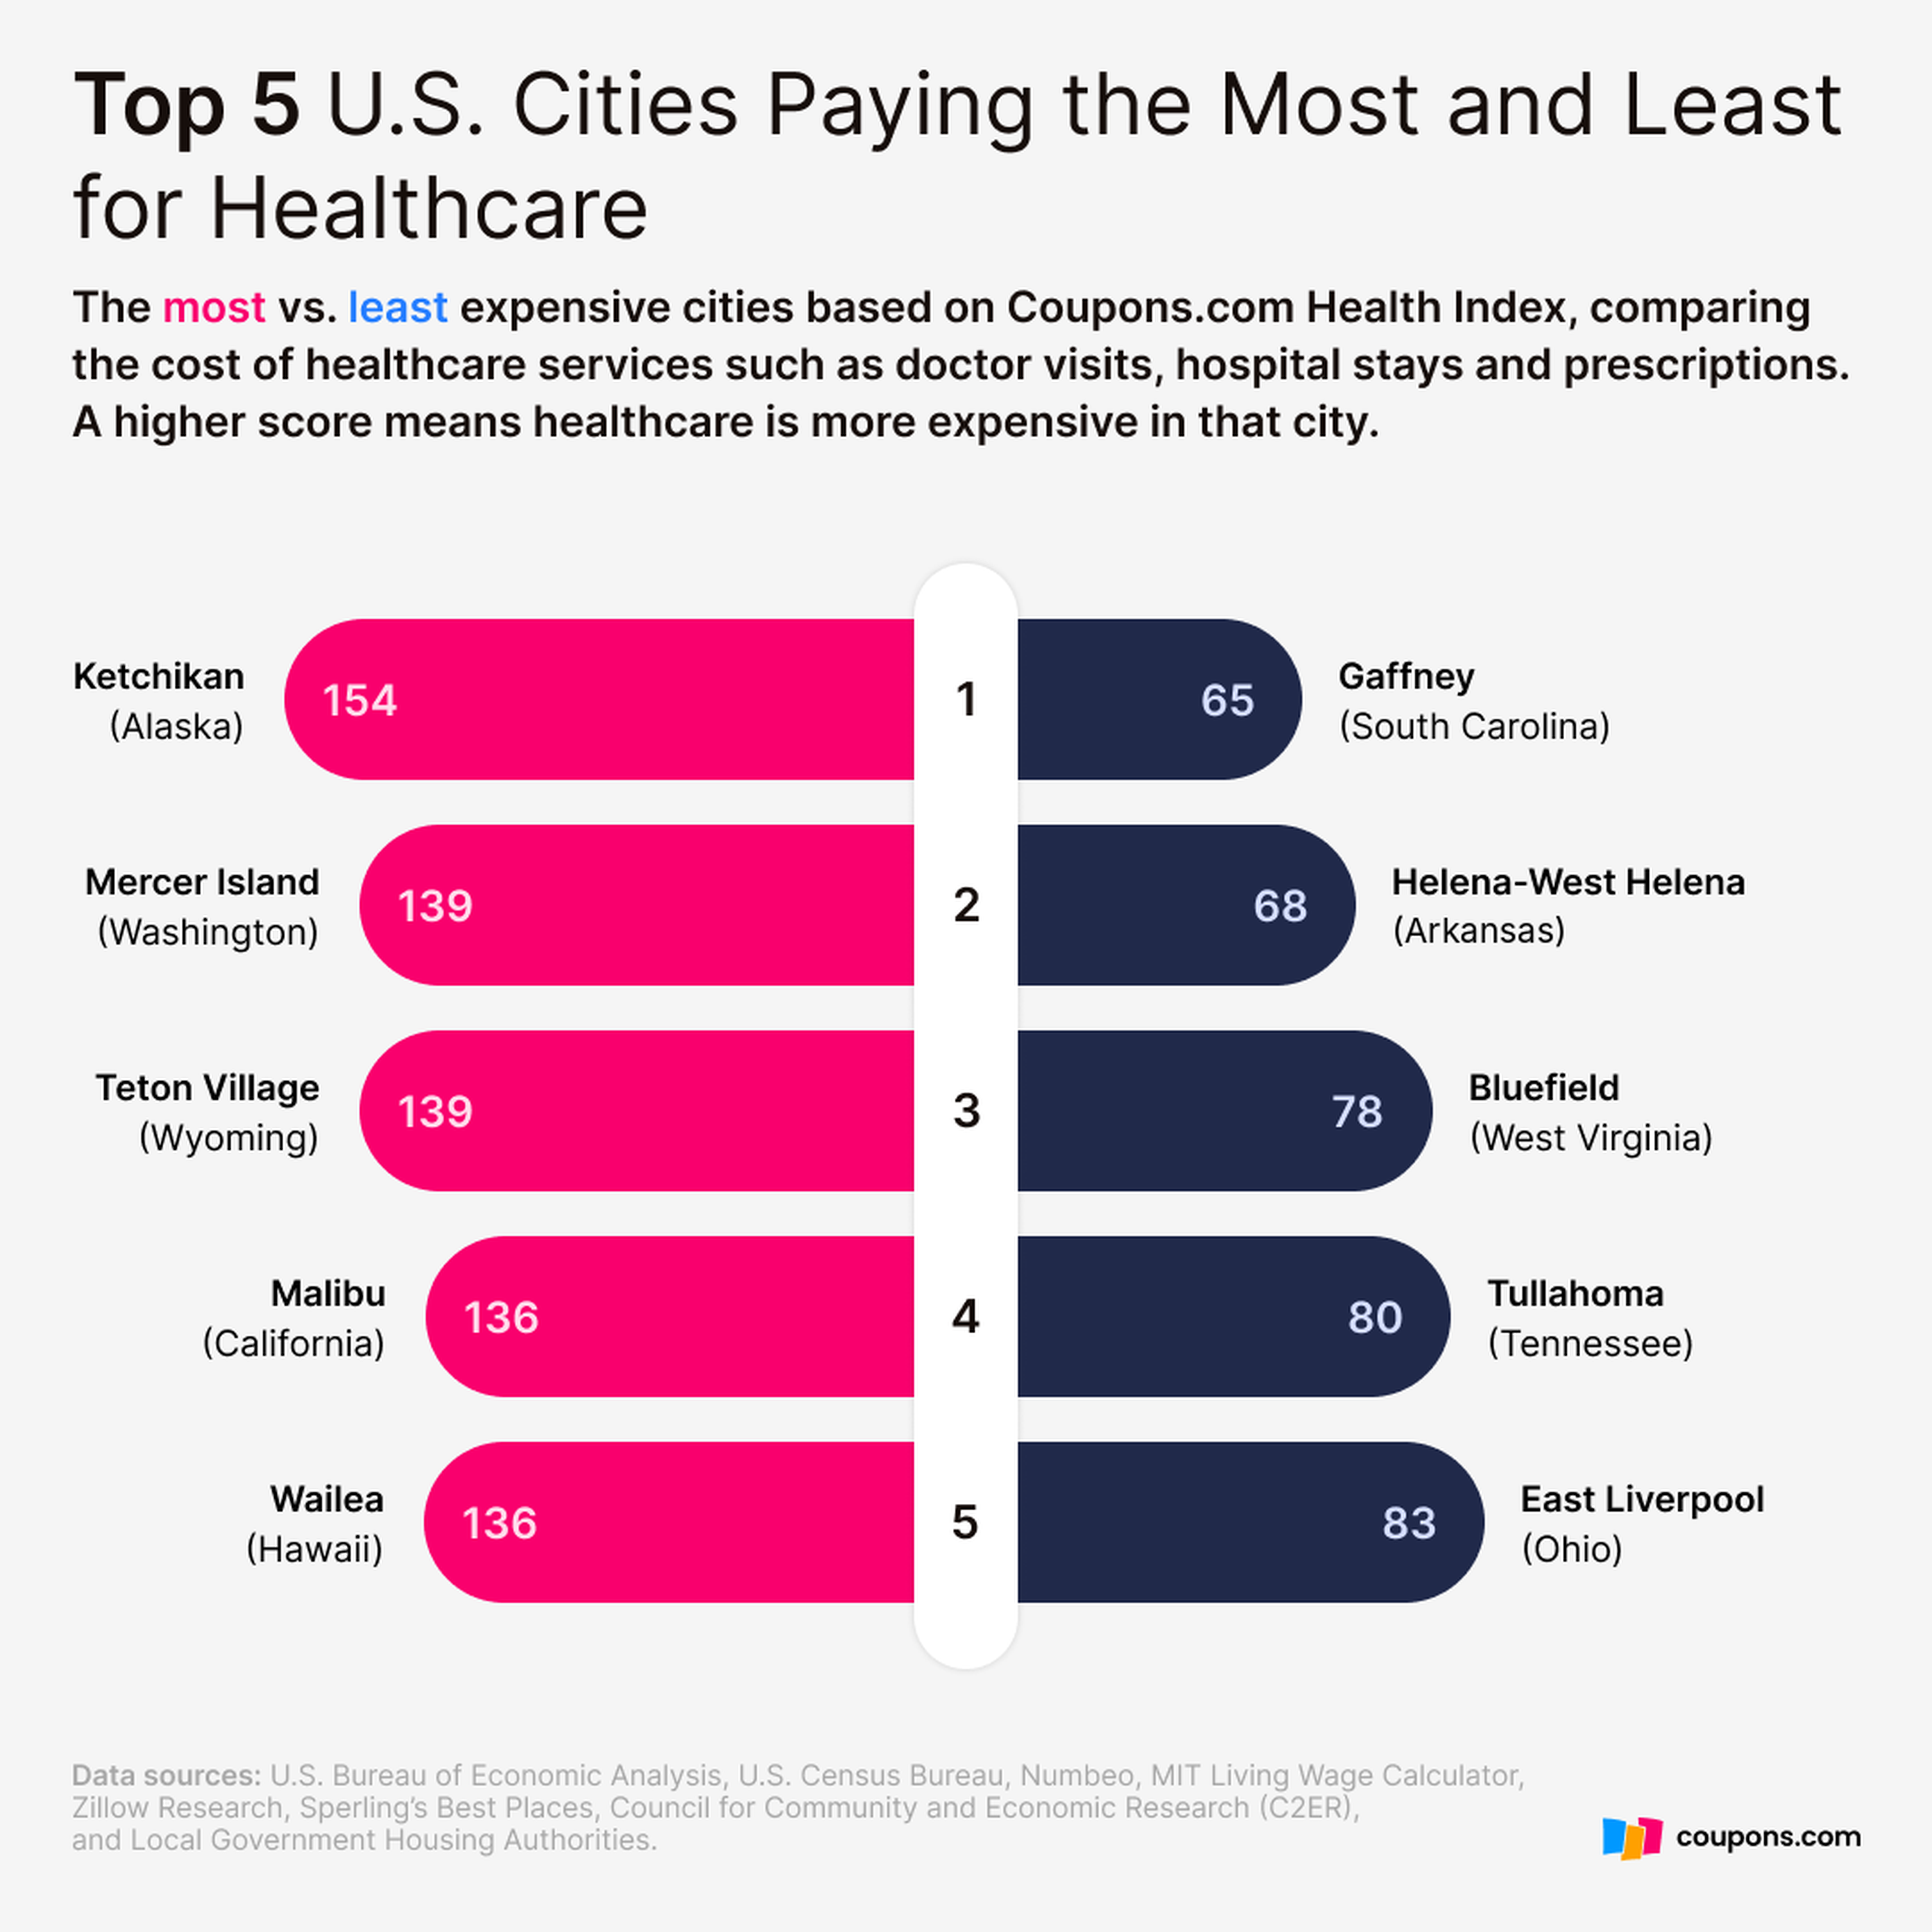
Healthcare index: This compares the cost of healthcare services such as GP visits, hospital stays and prescriptions. A higher score means healthcare is more expensive in that city.
Overall cost of living: This is the final cost of living score that combines each of the data points above. It’s based on a national average score of 100, so a score above 100 means the cost is higher than the US average and a score below 100 means it is lower than average.
Data Sources
U.S. Bureau of Economic Analysis (BEA) - www.bea.gov
U.S. Census Bureau - www.census.gov
Numbeo - www.numbeo.com
Crowdsourced Cost of Living Data
Monthly updates for groceries, transport, rent, and utilities
MIT Living Wage Calculator - livingwage.mit.edu
Zillow Research - www.zillow.com/research
Sperling's Best Places - www.bestplaces.net
Council for Community and Economic Research (C2ER) - www.coli.org
Local Government Housing Authorities
The Clip is where the people behind Coupons.com get to speak plainly. No press releases. No corporate polish. Just honest stories from people who think hard every day about helping you spend less and keep more.